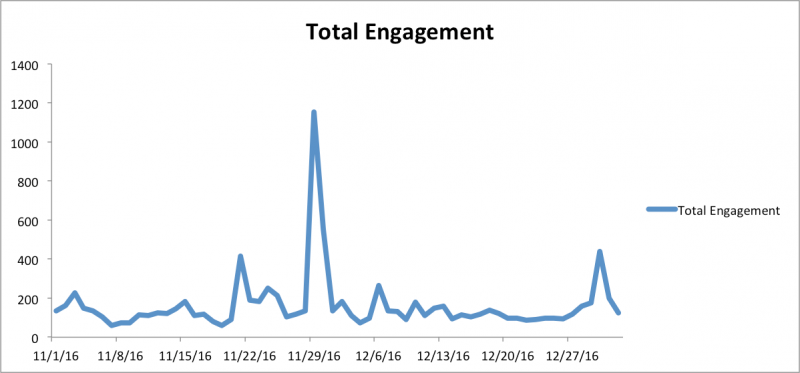
This semester we decided to look at the social media use of the popular non-profit charity: water. Their mission is to bring clean and safe drinking water to developing countries across the world. To look at their social media use we used Crimson Hexagon, and found key insights from November 1, 2016 to January 1, 2017. There were several days that spiked engagement and we plan to dive deeper below.

This graph shows the total engagement of owned posts. You can see a spike in engagement on November 22nd.
There was a spike in conversation on November 22, 2016 because all of charity:water’s projects were put on Google Maps.The highest increase in engagement was on November 29, 2016 because it was Giving Tuesday. December 6, 2016 had a spike in engagement because of the charity:water met gala on December 5. The final spike at the end of year was charity:water’s last push for donations for the year.
Charity:water encouraged their followers to go look at Google Maps to see what projects they had been working on or completed. Charity:water’s post related to Google Maps was popular among its followers and increased the engagement level with many followers joining in on the conversation. This post got 342 retweets and 72 mentions for charity:water in one day. Way more than their average retweets and mentions in the 70s and 60s respectively.
Even though there was an increase in engagement for November 22, when looking at the impressions for that day, they are much lower than other days, with potential impressions being 1,580,998. This is interesting to note since the conversation surrounding charity:water’s projects on Google Maps was positive. Based on our previous insights gathered we found that promotional tweets work well for charity:water. Charity:water could have had their new Google Maps information promoted by popular celebrities known for supporting Charity:water or even promoted by Google itself to increase the number of impressions.

